
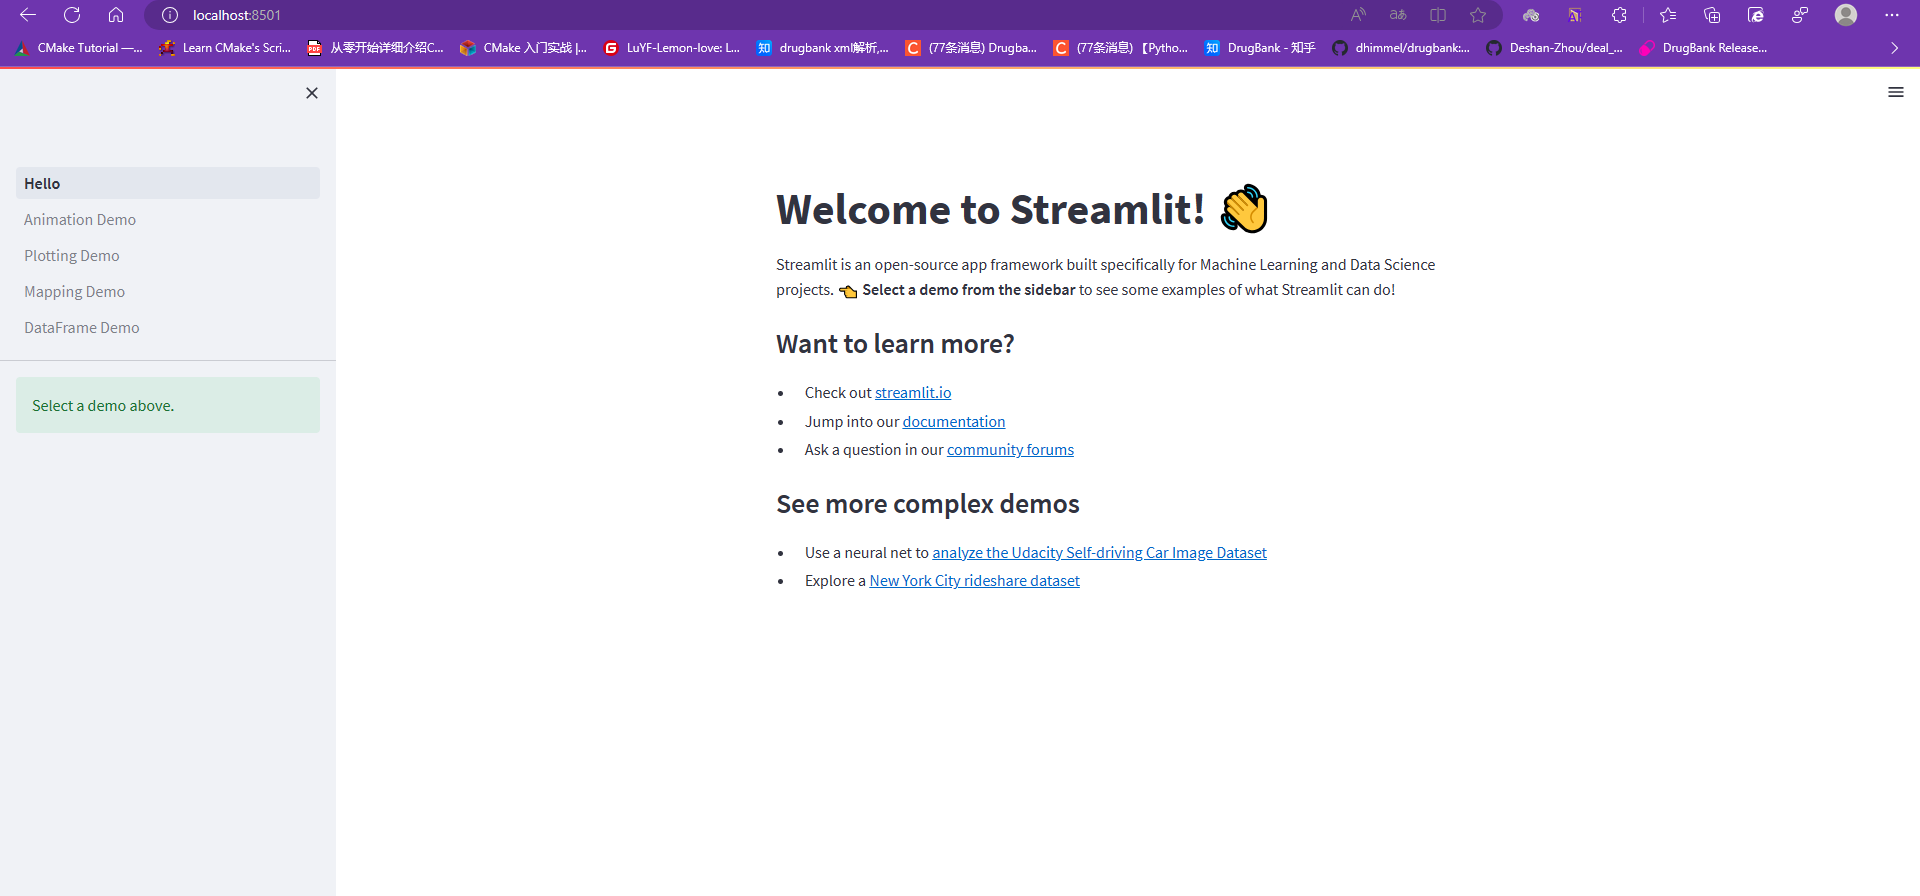
00072-Streamlit 学习笔记-windows10
前言
Streamlit 能够快速的在 Web 上展示您的 Python 和你的深度学习模型。
A faster way to build and share data apps
Streamlit turns data scripts into shareable web apps in minutes.
All in pure Python. No front‑end experience required.
本文运行的源代码: https://github.com/LuYF-Lemon-love/susu-streamlit .
操作系统:Windows 10 专业版
参考文档
安装
源教程链接: https://docs.streamlit.io/library/get-started/installation .
前置条件
python >= 3.8
创建虚拟环境
1 | python -m venv env |
安装 (Linux)
1 | pip install streamlit |
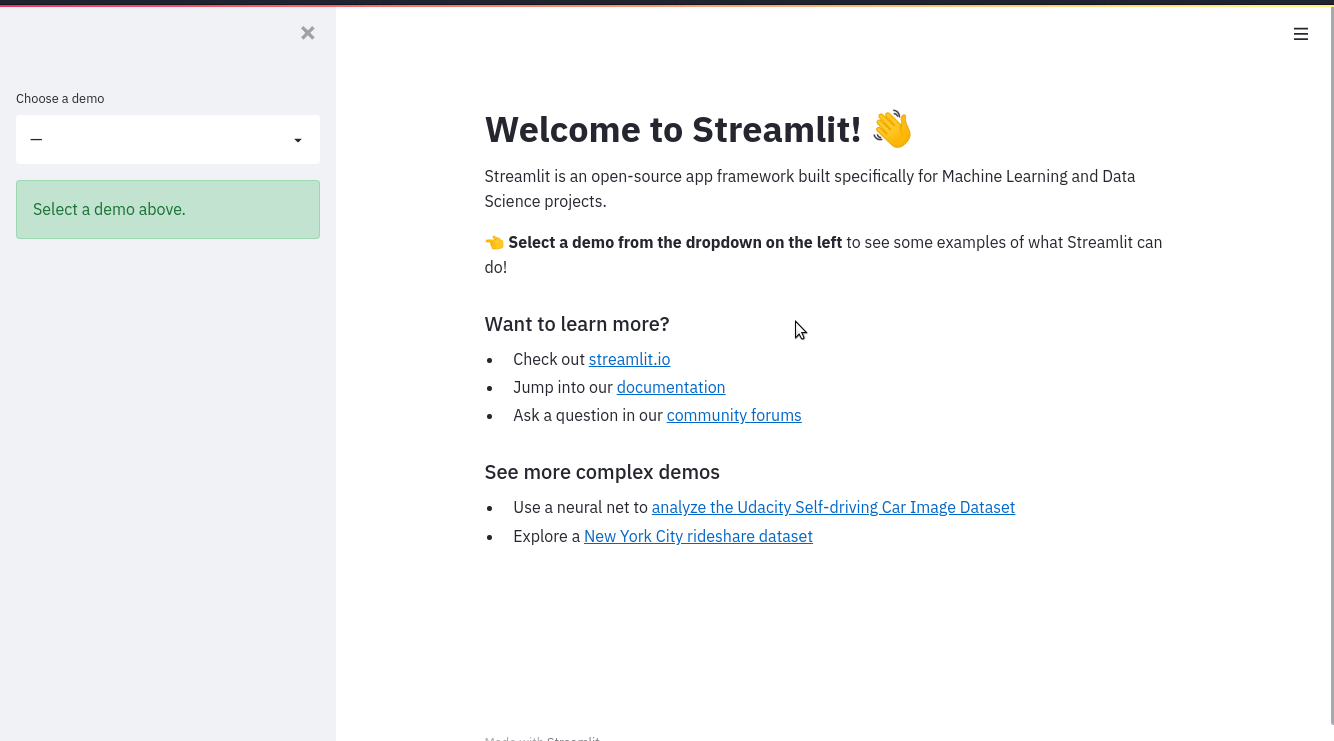
验证安装 (如果代码在服务器,可以利用 VSCode 转发端口(8501)):
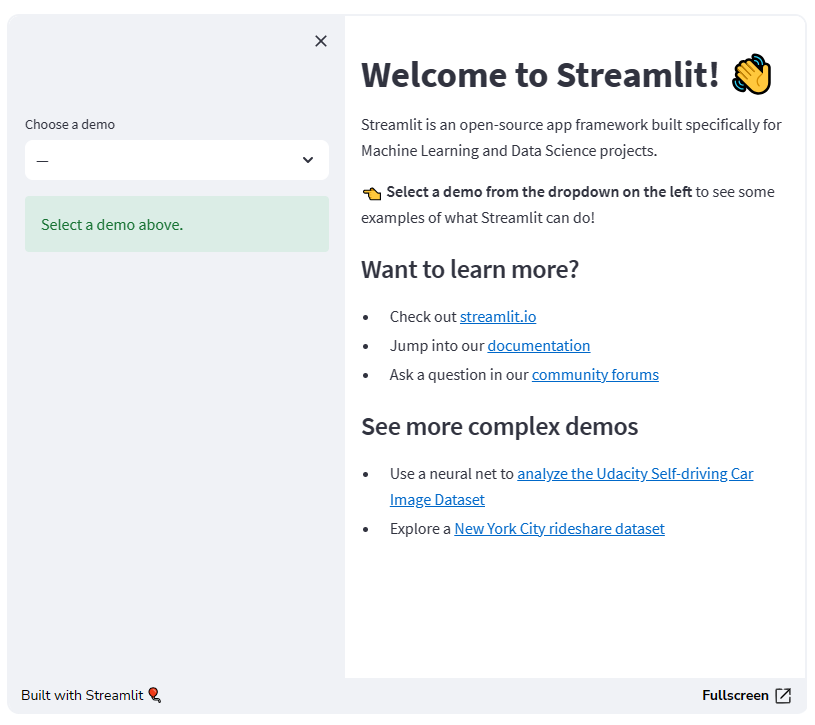
1 | streamlit hello |
现在你能利用 Streamlit 让用户和 Python 代码交互:
1 | streamlit run myfile.py |
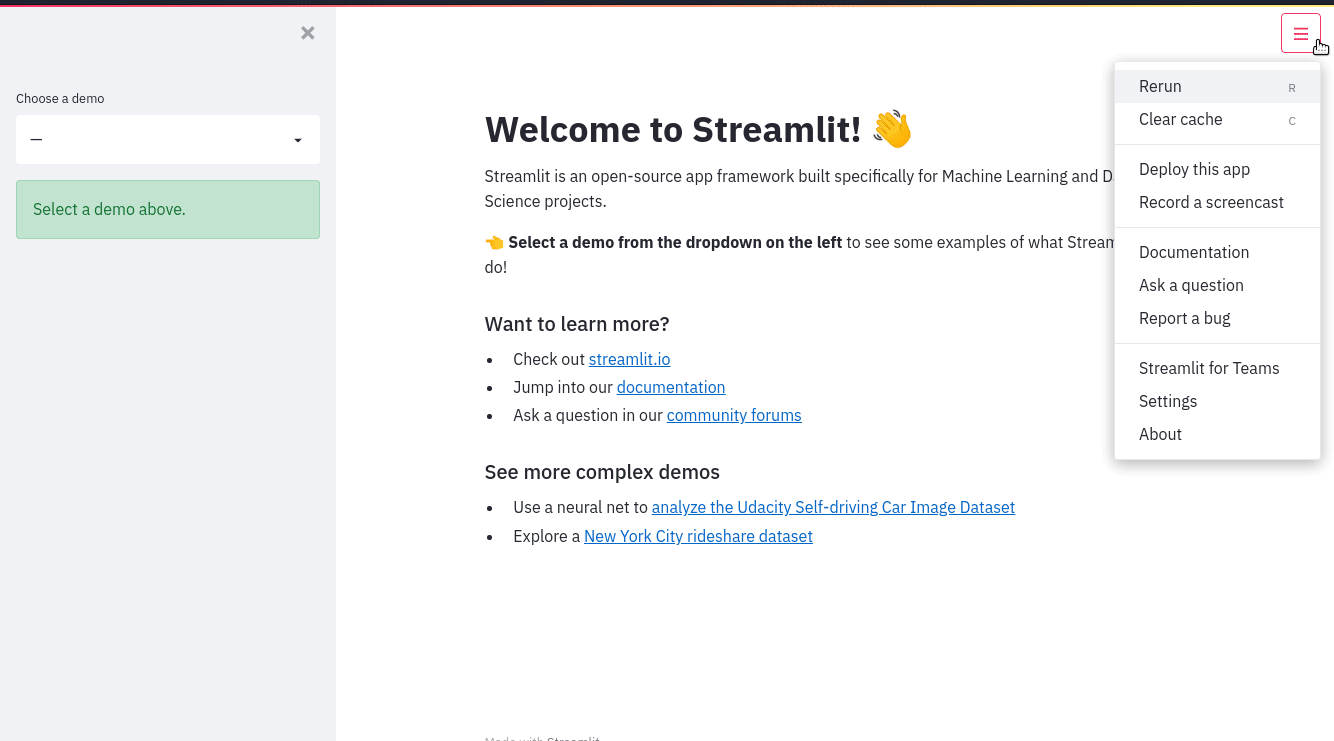
主要概念
源教程链接: https://docs.streamlit.io/library/get-started/main-concepts .
Streamlit 主要使用方式如下:
1 | streamlit run your_script.py [-- script args] |
之后将在你的默认浏览器上打开以 app,该应用程序是您的画布,您可以在其中绘制图表、文本、小部件、表格等。
st.text 将会绘制纯文本,st.line_chart 将会绘制一个线表。
When passing your script some custom arguments, they must be passed after two dashes. Otherwise the arguments get interpreted as arguments to Streamlit itself.
其他的使用方式:
1 | Running |
开发流程
Streamlit 会自动的检测源代码的变化,并自动的在 app 上更新。
数据流
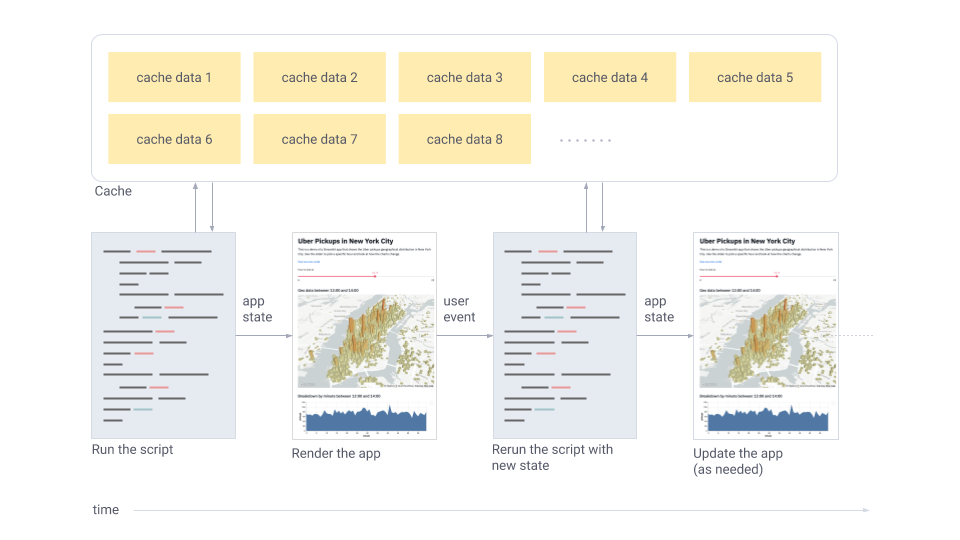
Any time something must be updated on the screen, Streamlit reruns your entire Python script from top to bottom.
This can happen in two situations:
Whenever you modify your app’s source code.
Whenever a user interacts with widgets in the app. For example, when dragging a slider, entering text in an input box, or clicking a button.
And to make all of this fast and seamless, Streamlit does some heavy lifting for you behind the scenes. A big player in this story is the
@st.cache_datadecorator, which allows developers to skip certain costly computations when their apps rerun.
展示数据
使用 magic 展示数据
1 | """ |
一旦 Streamlit 看到单独一行的变量或字面值,它将自动的利用 st.write() 写到 app 中。
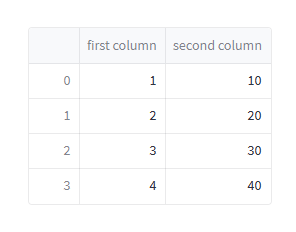
写一个 data frame
You can pass almost anything to
st.write(): text, data, Matplotlib figures, Altair charts, and more. Don’t worry, Streamlit will figure it out and render things the right way.
1 | import streamlit as st |
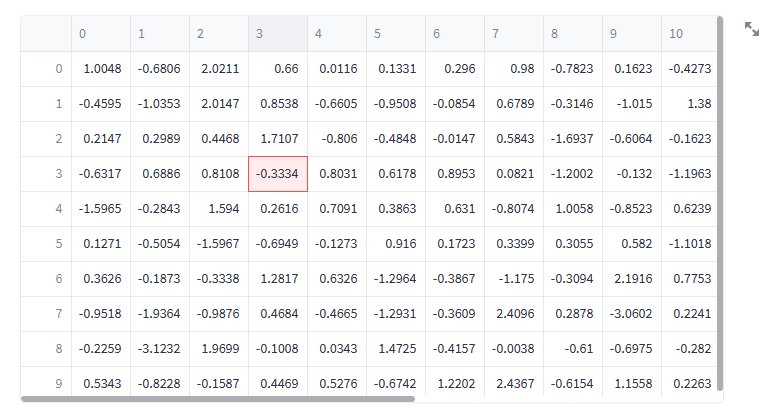
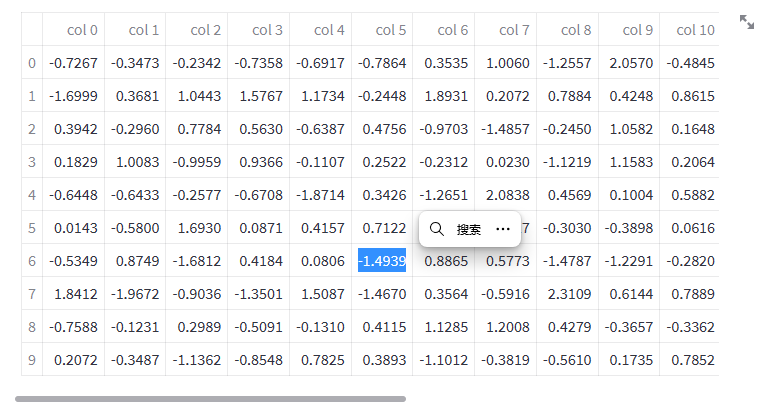
也有一些其他的方法 (st.dataframe() 和 st.table()) 展示数据。如果自定义样式请使用特定的方法,下面使用 st.dataframe() 展示一个交互性的表格.
1 | import streamlit as st |
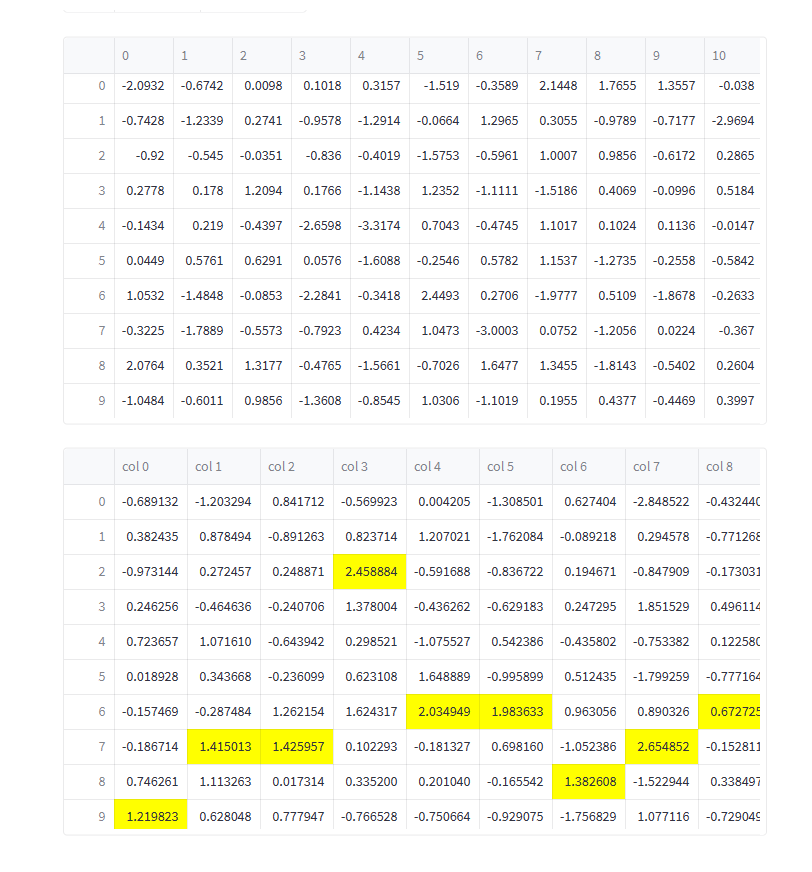
下面我们使用 Pandas Styler object 高亮一些元素.
1 | import streamlit as st |
对于静态表格请使用 st.table()
1 | import streamlit as st |
动态(上)和静态(下)
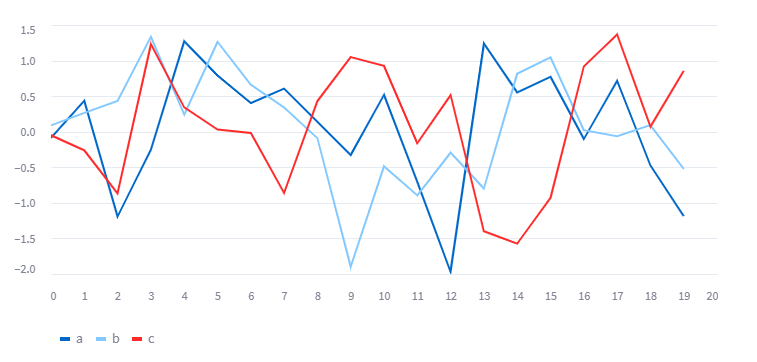
绘制 line chart
你能使用 st.line_chart() 绘制一个线表。
1 | import streamlit as st |
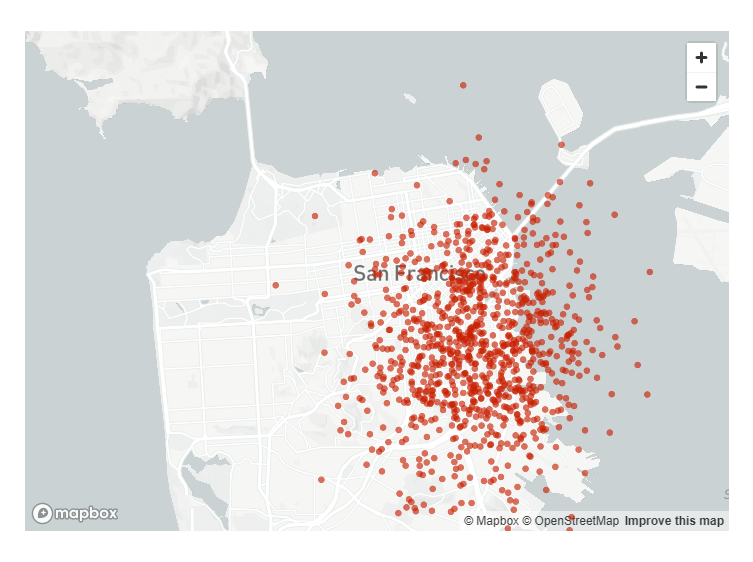
绘制 map
能够使用 st.map() 绘制一个 map。
1 | import streamlit as st |
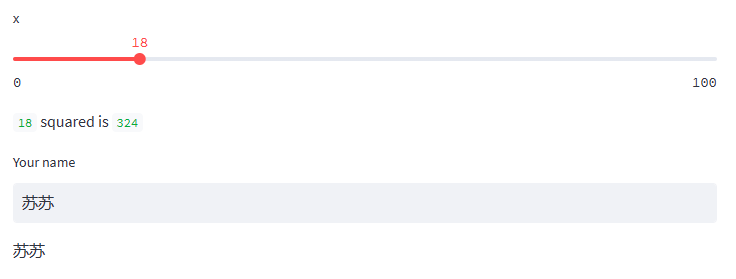
Widgets
你能加上如下 widgets: st.slider(),st.button() 或 st.selectbox()。
你可以将 widgets 看成变量。
1 | import streamlit as st |
你也可以为 widgets 指定名字,进而通过名字访问:
1 | import streamlit as st |
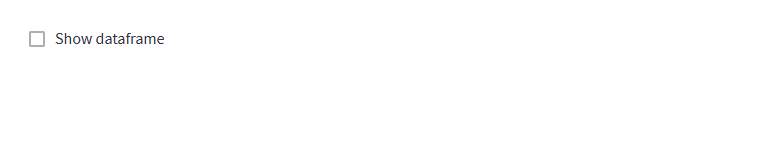
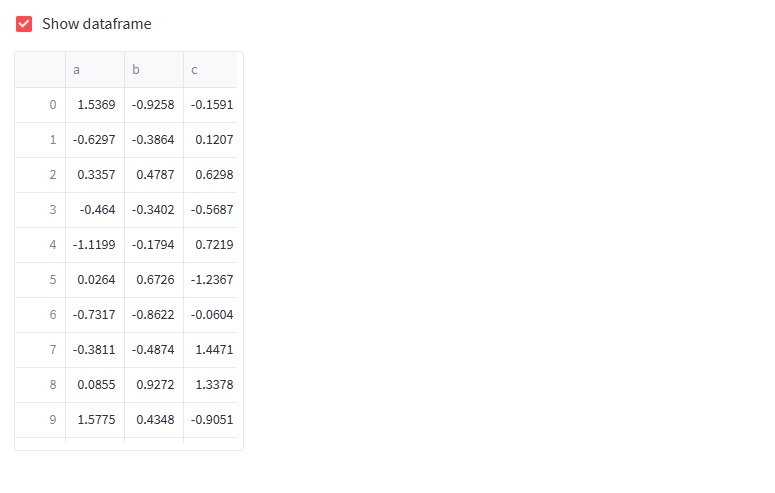
checkboxes
使用复选框显示/隐藏数据 (st.checkbox())
1 | import streamlit as st |
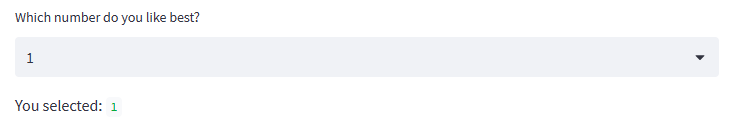
selectbox
您能使用 st.selectbox 做出选择。
1 | import streamlit as st |
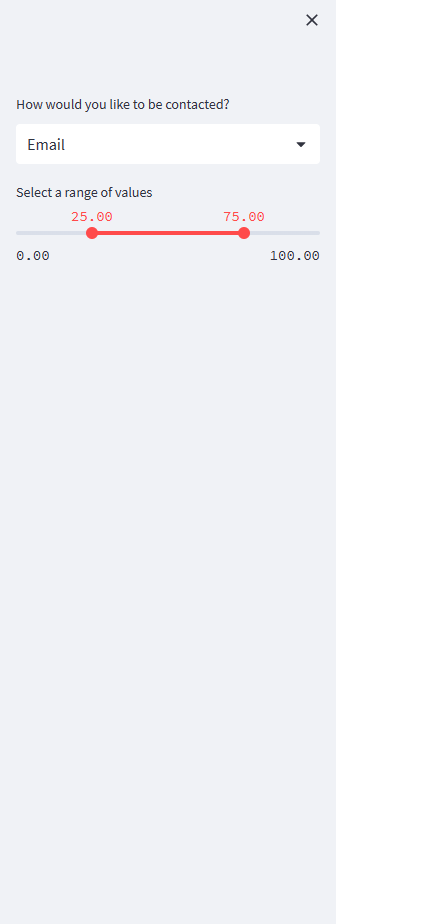
Layout
Streamlit makes it easy to organize your widgets in a left panel sidebar with
st.sidebar. Each element that’s passed tost.sidebaris pinned to the left, allowing users to focus on the content in your app while still having access to UI controls.For example, if you want to add a selectbox and a slider to a sidebar, use
st.sidebar.sliderandst.sidebar.selectboxinstead ofst.sliderandst.selectbox:
1 | import streamlit as st |
Beyond the sidebar, Streamlit offers several other ways to control the layout of your app.
st.columnslets you place widgets side-by-side, andst.expanderlets you conserve space by hiding away large content.
1 | import streamlit as st |
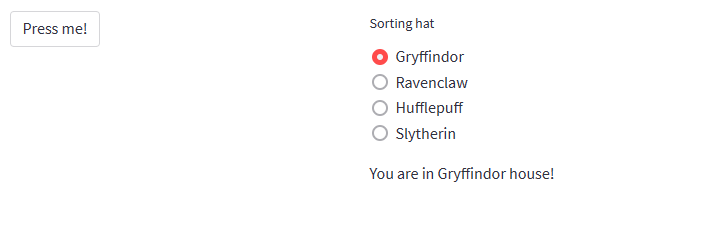
单选按钮: st.radio
st.echoandst.spinnerare not currently supported inside the sidebar or layout options. Rest assured, though, we’re currently working on adding support for those too!
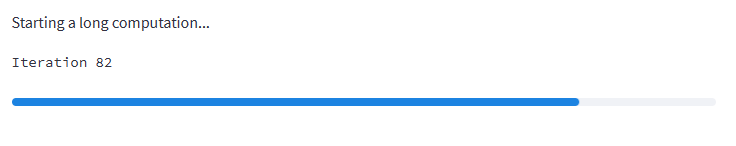
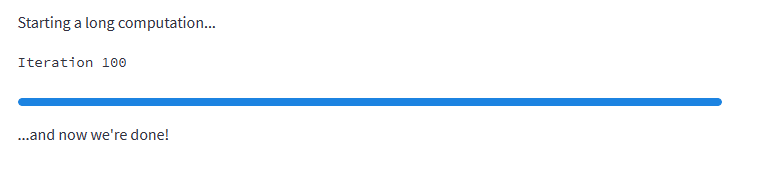
进度条
你也可以加入进度条: st.progress()
1 | import streamlit as st |
主题
原生支持 Light 和 Dark 主题,默认使用操作系统和浏览器的设置,如果未设置使用 Light。
你也能手动设置。
When you’re happy with your work, themes can be saved by setting config options in the
[theme]config section. After you’ve defined a theme for your app, it will appear as “Custom Theme” in the theme selector and will be applied by default instead of the included Light and Dark themes.The theme editor menu is available only in local development. If you’ve deployed your app using Streamlit Community Cloud, the “Edit active theme” button will no longer be displayed in the “Settings” menu.
Another way to experiment with different theme colors is to turn on the “Run on save” option, edit your config.toml file, and watch as your app reruns with the new theme colors applied.
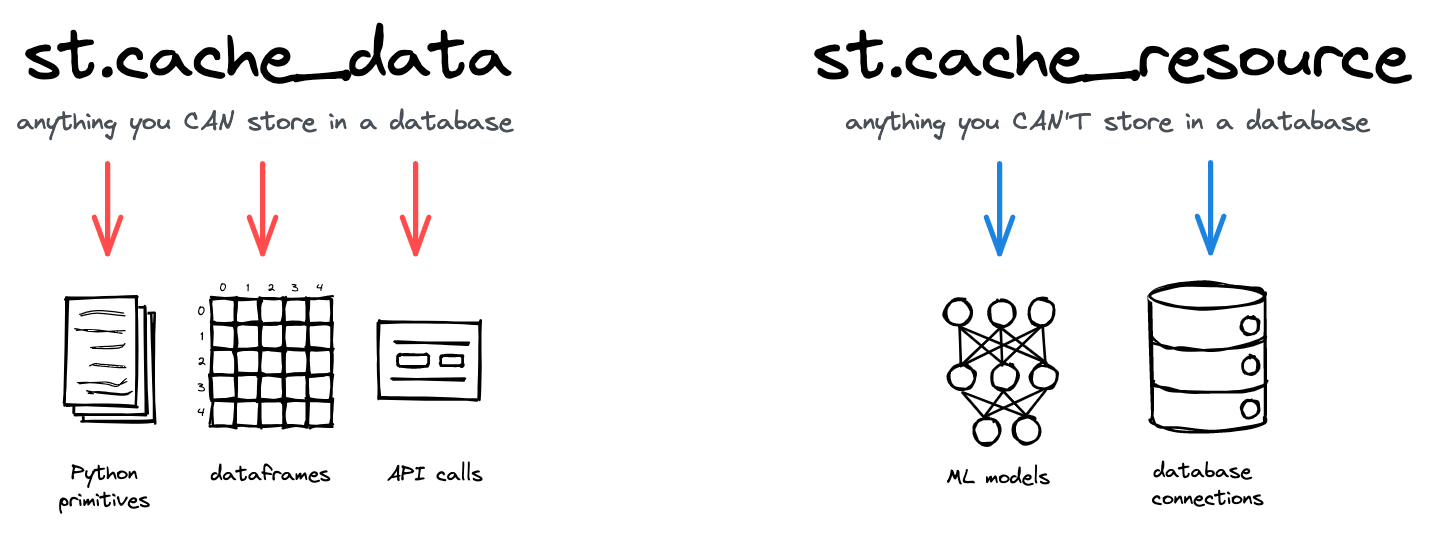
Caching
你可以使用两个装饰器 (st.cache_data 和 st.cache_resource) 缓存函数。
1 |
|
st.cache_datais the recommended way to cache computations that return data: loading a DataFrame from CSV, transforming a NumPy array, querying an API, or any other function that returns a serializable data object (str, int, float, DataFrame, array, list, …). It creates a new copy of the data at each function call, making it safe against mutations and race conditions. The behavior ofst.cache_datais what you want in most cases – so if you’re unsure, start withst.cache_dataand see if it works!
st.cache_resourceis the recommended way to cache global resources like ML models or database connections – unserializable objects that you don’t want to load multiple times. Using it, you can share these resources across all reruns and sessions of an app without copying or duplication. Note that any mutations to the cached return value directly mutate the object in the cache (more details below).
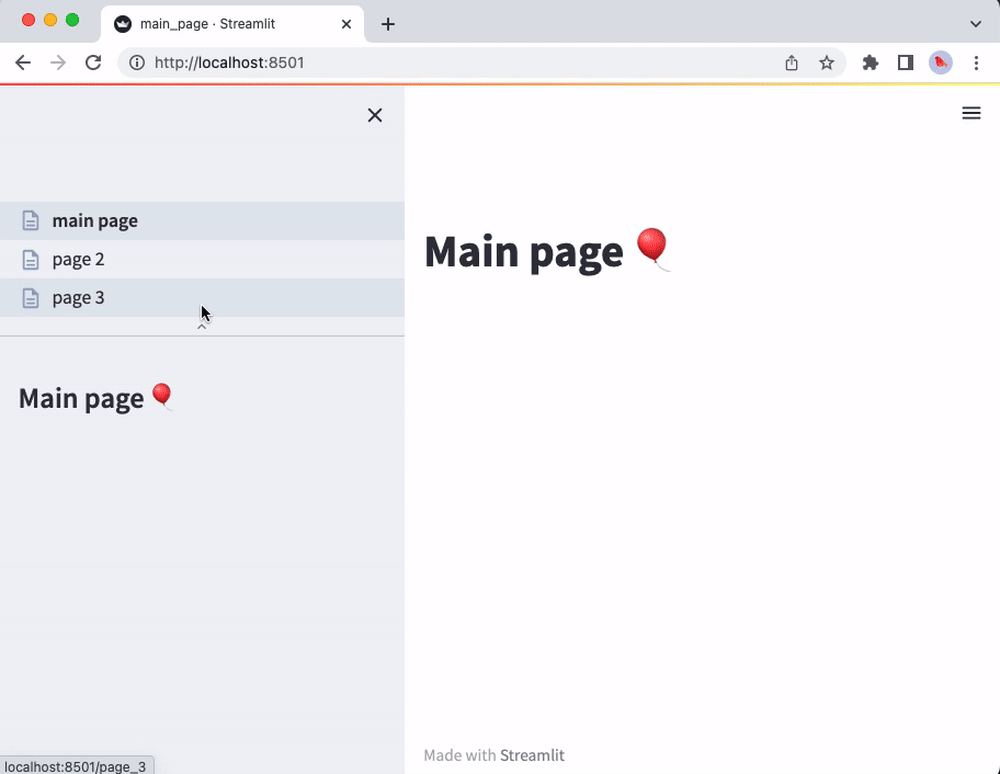
Pages
Streamlit 提供了一种容易的方式来创建多页应用程序。
We designed this feature so that building a multipage app is as easy as building a single-page app! Just add more pages to an existing app as follows:
-
In the folder containing your main script, create a new
pagesfolder. Let’s say your main script is namedmain_page.py. -
Add new
.pyfiles in thepagesfolder to add more pages to your app. -
Run
streamlit run main_page.pyas usual.
That’s it! The main_page.py script will now correspond to the main page of your app. And you’ll see the other scripts from the pages folder in the sidebar page selector. For example:
main_page.py
1 | import streamlit as st |
pages/page_2.py
1 | import streamlit as st |
pages/page_3.py
1 | import streamlit as st |
运行 streamlit run main_page.py
App model
Now that you know a little more about all the individual pieces, let’s close the loop and review how it works together:
-
Streamlit apps are Python scripts that run from top to bottom
-
Every time a user opens a browser tab pointing to your app, the script is re-executed
-
As the script executes, Streamlit draws its output live in a browser
-
Scripts use the Streamlit cache to avoid recomputing expensive functions, so updates happen very fast
-
Every time a user interacts with a widget, your script is re-executed and the output value of that widget is set to the new value during that run.
-
Streamlit apps can contain multiple pages, which are defined in separate .py files in a pages folder.
创建一个 app
源教程链接: https://docs.streamlit.io/library/get-started/create-an-app .
创建你的第一个 app
- 创建一个
uber_pickups.py。
1 | import streamlit as st |
- 设置 app 的标题。
1 | st.title('Uber pickups in NYC') |
- 运行 app。
1 | streamlit run uber_pickups.py |
Fetch some data
- 加载数据的函数:
1 | DATE_COLUMN = 'date/time' |
该函数接受一个参数(nrows),该参数指定要加载的行数。
- 测试函数:
1 | # Create a text element and let the reader know the data is loading. |
You’ll see a few buttons in the upper-right corner of your app asking if you’d like to rerun the app. Choose Always rerun, and you’ll see your changes automatically each time you save.
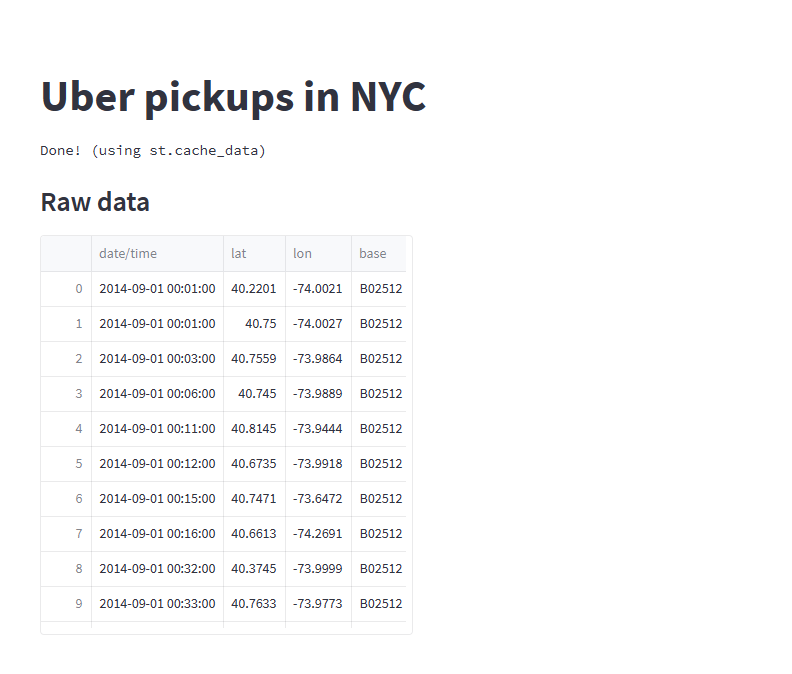
您不想在每次更新应用程序时重新加载数据 - 幸运的是,Streamlit允许您缓存数据。
缓存
- 在
load_data声明之前添加@st.cache_data:
1 |
|
-
先在浏览器刷新一下界面。
-
用下面的代码替换
data_load_state.text('Loading data...done!'):
1 | data_load_state.text("Done! (using st.cache_data)") |
限制
-
Streamlit will only check for changes within the current working directory. If you upgrade a Python library, Streamlit’s cache will only notice this if that library is installed inside your working directory.
-
If your function is not deterministic (that is, its output depends on random numbers), or if it pulls data from an external time-varying source (for example, a live stock market ticker service) the cached value will be none-the-wiser.
-
Lastly, you should avoid mutating the output of a function cached with st.cache_data since cached values are stored by reference.
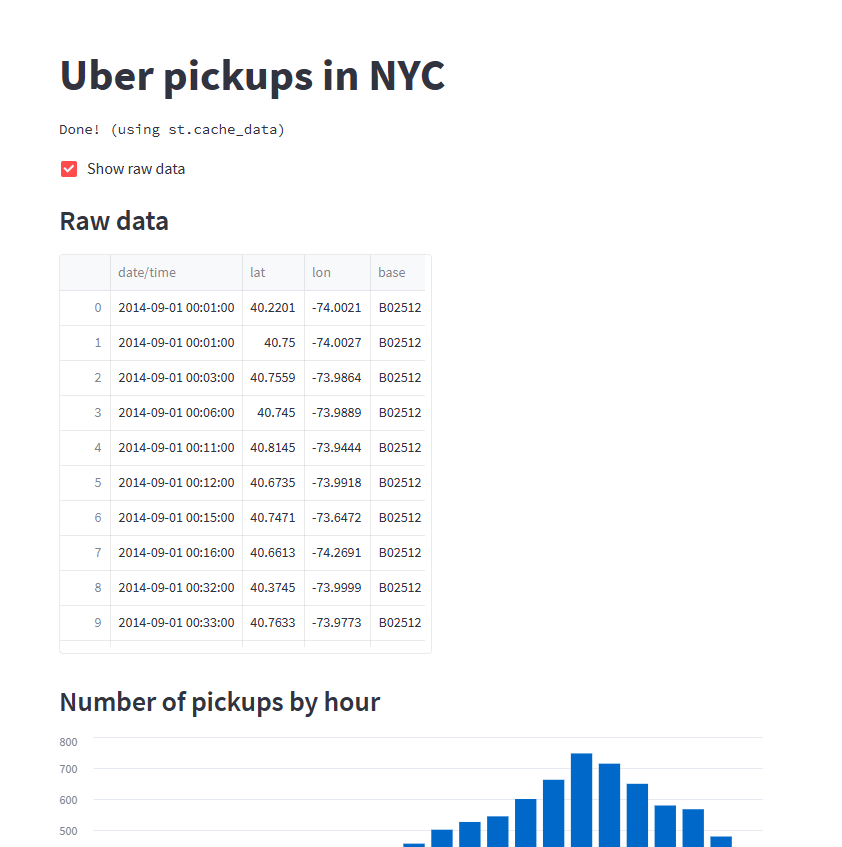
检查原始数据
加一个副标题:
1 | st.subheader('Raw data') |
绘制直方图
- 加入新的副标题:
1 | st.subheader('Number of pickups by hour') |
- 利用 NumPy 生成直方图:
1 | hist_values = np.histogram( |
- 使用
st.bar_chart()画直方图:
1 | st.bar_chart(hist_values) |
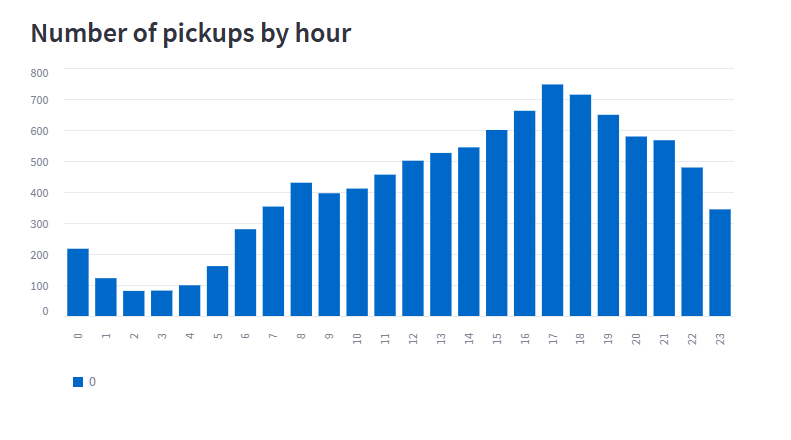
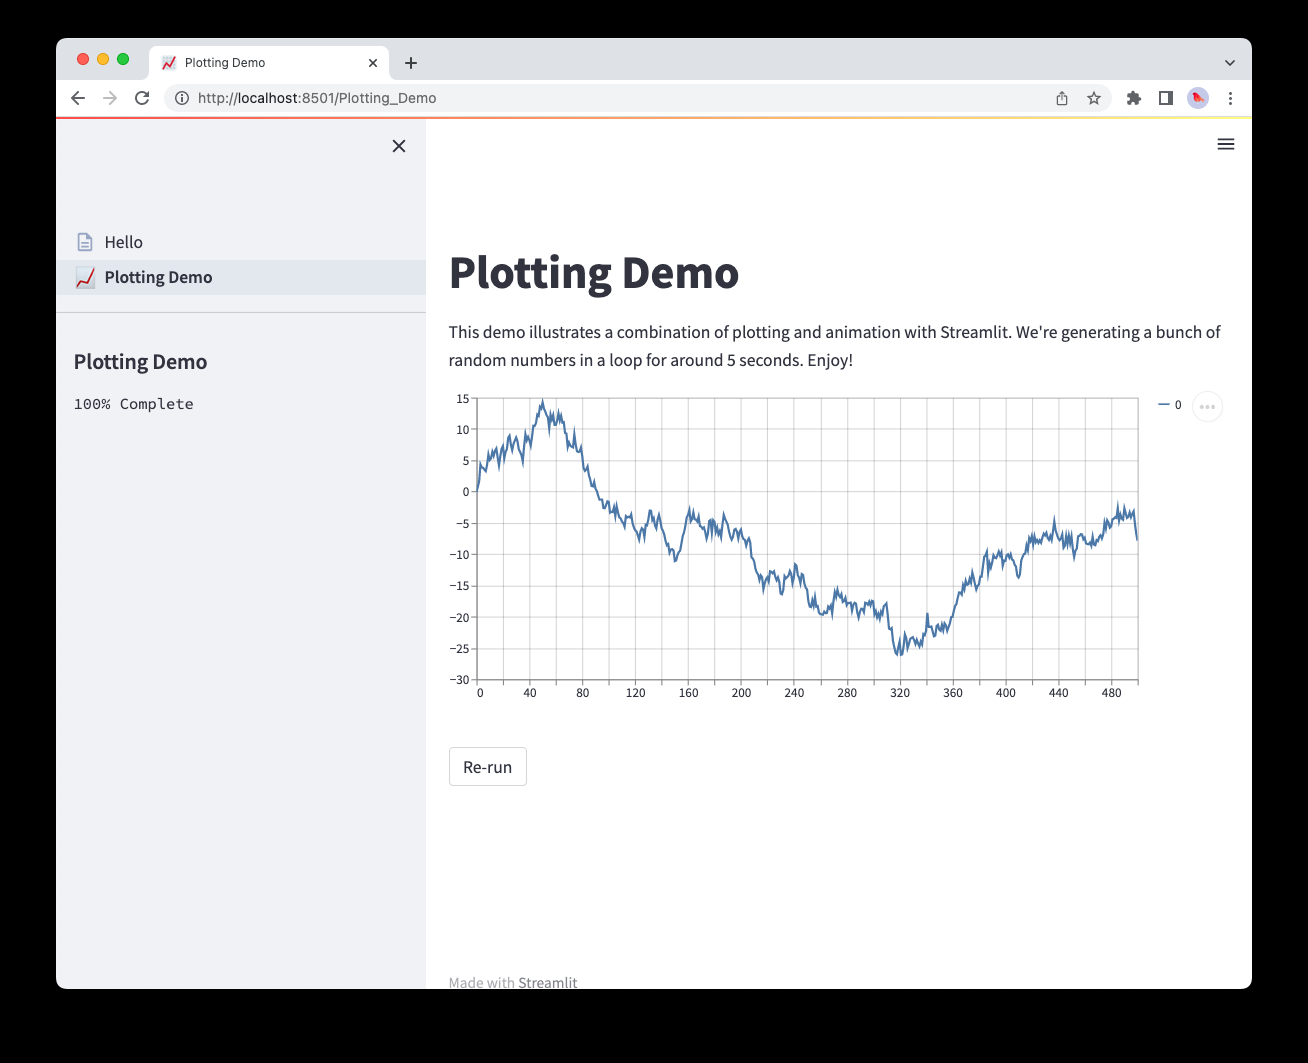
To draw this diagram we used Streamlit’s native
bar_chart()method, but it’s important to know that Streamlit supports more complex charting libraries likeAltair,Bokeh,Plotly,Matplotliband more.
Plot data on a map
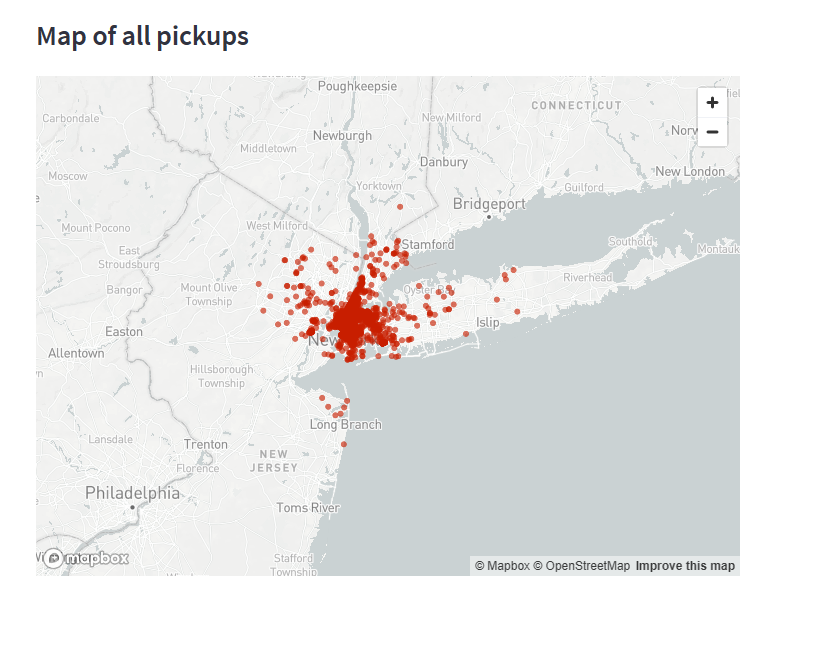
- 加一个副标题:
1 | st.subheader('Map of all pickups') |
- 使用
st.map():
1 | st.map(data) |
Let’s redraw the map to show the concentration of pickups at 17:00.
- 找到下面代码段:
1 | st.subheader('Map of all pickups') |
- 用下面的代码段替换它:
1 | hour_to_filter = 17 |
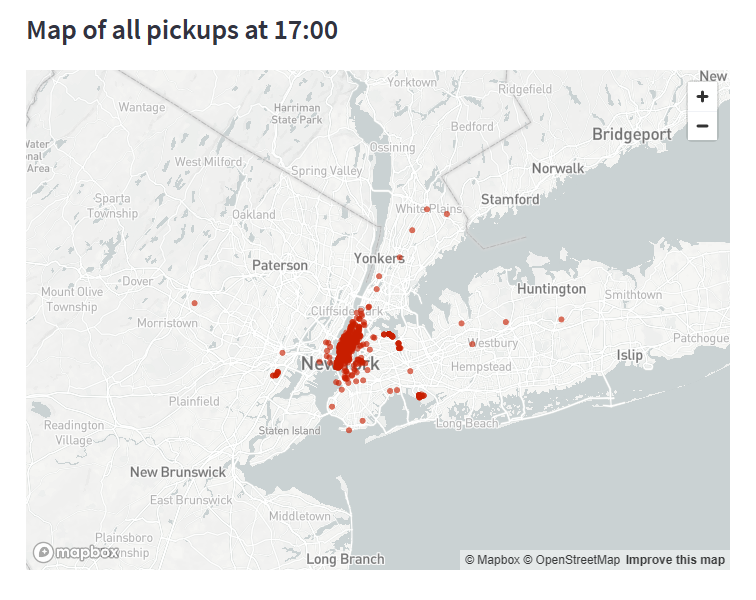
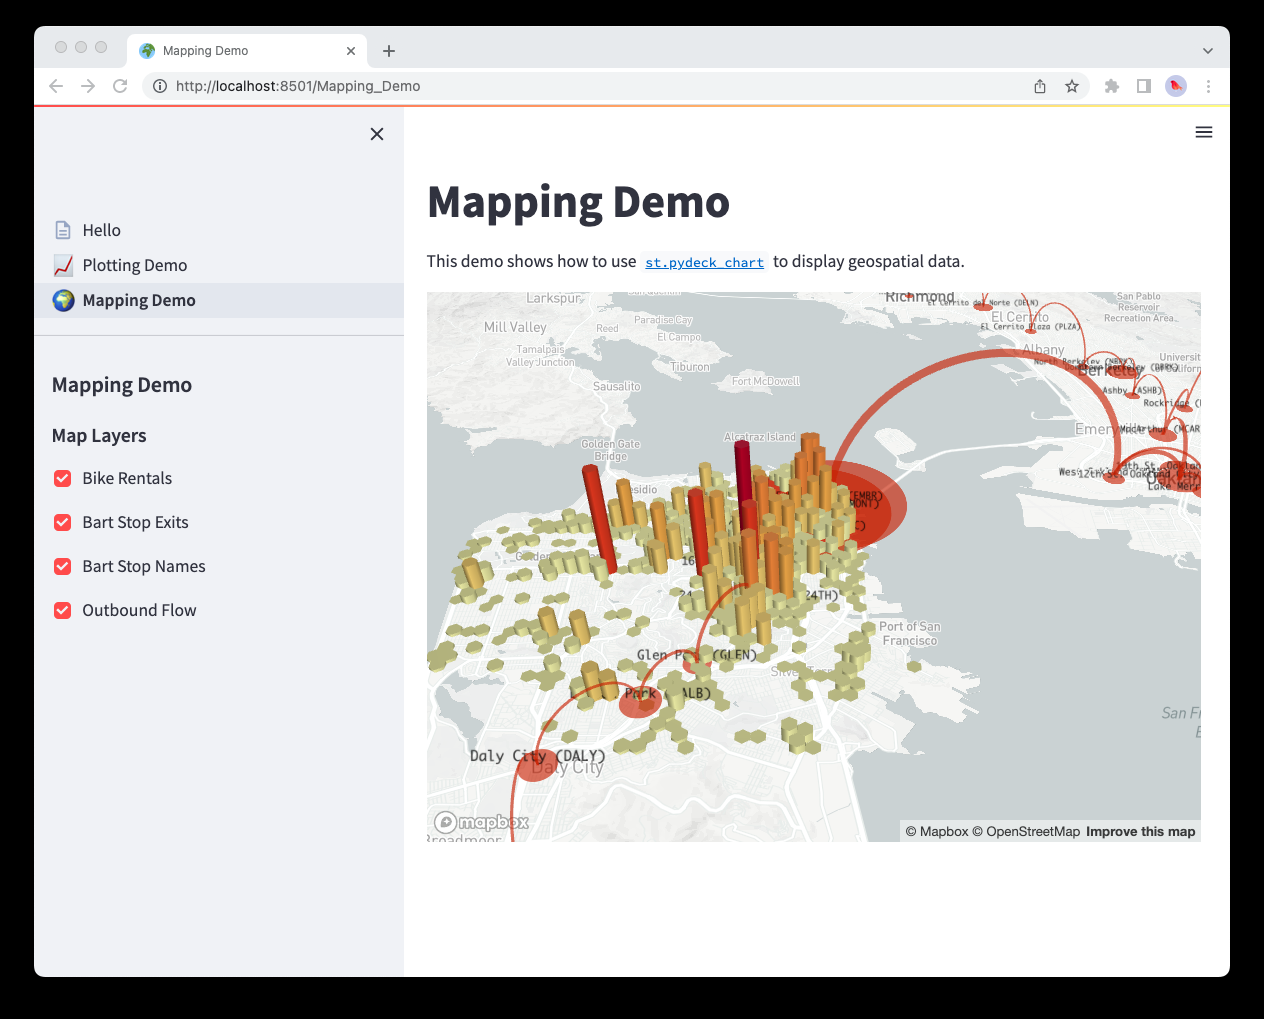
To draw this map we used the
st.mapfunction that’s built into Streamlit, but if you’d like to visualize complex map data, we encourage you to take a look at thest.pydeck_chart.
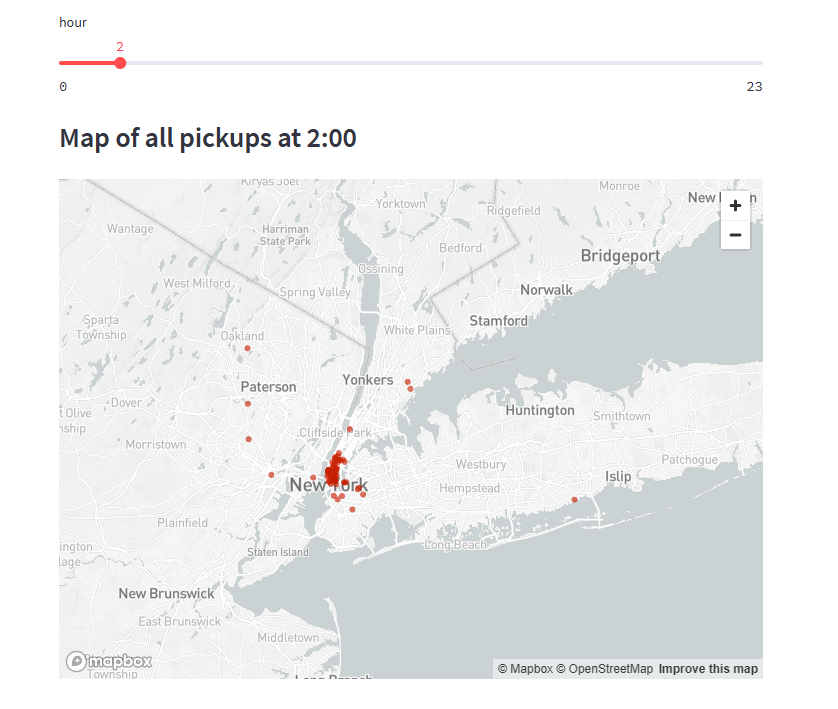
Filter results with a slider
找到hour_to_filter并将其替换为以下代码片段:
1 | hour_to_filter = st.slider('hour', 0, 23, 17) # min: 0h, max: 23h, default: 17h |
Use a button to toggle data
- 找到以下行:
1 | st.subheader('Raw data') |
- 将这些行替换为以下代码:
1 | if st.checkbox('Show raw data'): |
Let’s put it all together
1 | import streamlit as st |
Share your app
After you’ve built a Streamlit app, it’s time to share it! To show it off to the world you can use Streamlit Community Cloud to deploy, manage, and share your app for free.
It works in 3 simple steps:
-
Put your app in a public GitHub repo (and make sure it has a requirements.txt!)
-
Sign into share.streamlit.io
-
Click ‘Deploy an app’ and then paste in your GitHub URL
That’s it! 🎈 You now have a publicly deployed app that you can share with the world.
Get help
That’s it for getting started, now you can go and build your own apps! If you run into difficulties here are a few things you can do.
-
Check out our community forum and post a question
-
Quick help from command line with
streamlit help -
Go through our Knowledge Base for tips, step-by-step tutorials, and articles that answer your questions about creating and deploying Streamlit apps.
-
Read more documentation! Check out:
-
Advanced features for things like caching, theming, and adding statefulness to apps.
-
API reference for examples of every Streamlit command.
-
Multipage apps
源教程链接: https://docs.streamlit.io/library/get-started/multipage-apps .
Run a multipage app
运行命令为:
1 | streamlit run [entrypoint file] |
The “entrypoint file” is the first page the app will show to the user. Once you have added pages to your app, the entrypoint file appears as the top-most page in the sidebar. You can think of the entrypoint file as your app’s “main page”. For example, say your entrypoint file is Home.py. Then, to run your app, you can run streamlit run Home.py. This will start your app and execute the code in Home.py.
Adding pages
Once you’ve created your entrypoint file, you can add pages by creating .py files in a pages/ directory relative to your entrypoint file. For example, if your entrypoint file is Home.py, then you can create a pages/About.py file to define the “About” page. Here’s a valid directory structure for a multipage app:
1 | Home.py # This is the file you run with "streamlit run" |
When adding emojis to filenames, it’s best practice to include a numbered-prefix to make autocompletion in your terminal easier. Terminal-autocomplete can get confused by unicode (which is how emojis are represented).
Pages are defined as .py files in a pages/ directory. The filenames of pages are transformed to page names in the sidebar based on the the rules in the section below. For example, the About.py file will appear as “About” in the sidebar, 2_Page_two.py appears as “Page two”, and 3_😎_three.py appears as “😎 three":
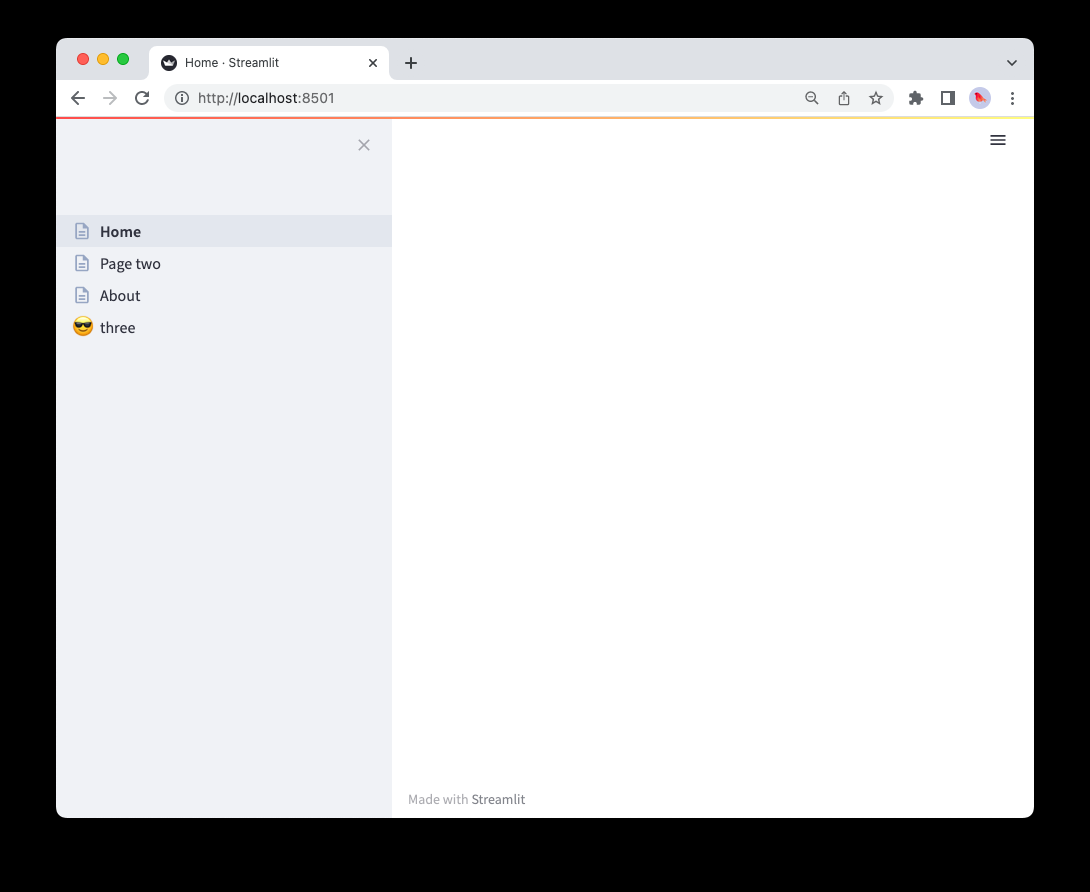
Only .py files in the pages/ directory will be loaded as pages. Streamlit ignores all other files in the pages/ directory and subdirectories.
How pages are labeled and sorted in the UI
Page labels in the sidebar UI are generated from filenames. They may differ from the page title set in st.set_page_config. Let’s learn what constitutes a valid filename for a page, how pages are displayed in the sidebar, and how pages are sorted.
Valid filenames for pages
Filenames are composed of four different parts:
-
A
number— if the file is prefixed with a number. -
A separator — could be
_,-, space, or any combination thereof. -
A
label— which is everything up to, but not including,.py. -
The extension — which is always
.py.
How pages are displayed in the sidebar
What is displayed in the sidebar is the label part of the filename:
-
If there’s no
label, Streamlit uses thenumberas the label. -
In the UI, Streamlit beautifies the
labelby replacing_with space.
How pages are sorted in the sidebar
Sorting considers numbers in the filename to be actual numbers (integers):
-
Files that have a
numberappear before files without anumber. -
Files are sorted based on the
number(if any), followed by thetitle(if any). -
When files are sorted, Streamlit treats the
numberas an actual number rather than a string. So03is the same as3.
This table shows examples of filenames and their corresponding labels, sorted by the order in which they appear in the sidebar.
Examples:
| Filename | Rendered label |
|---|---|
| 1 - first page.py | first page |
| 12 monkeys.py | monkeys |
| 123.py | 123 |
| 123_hello_dear_world.py | hello dear world |
| _12 monkeys.py | 12 monkeys |
Emojis can be used to make your page names more fun! For example, a file named
🏠_Home.pywill create a page titled “🏠 Home” in the sidebar.
Navigating between pages
Pages are automatically shown in a nice navigation UI inside the app’s sidebar. When you click on a page in the sidebar UI, Streamlit navigates to that page without reloading the entire frontend — making app browsing incredibly fast!
You can also navigate between pages using URLs. Pages have their own URLs, defined by the file’s label. When multiple files have the same label, Streamlit picks the first one (based on the ordering described above). Users can view a specific page by visiting the page’s URL.
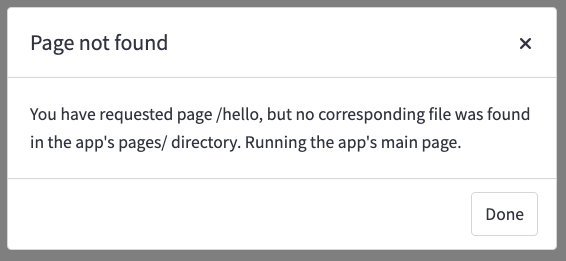
If a user tries to access a URL for a page that does not exist, they will see a modal like the one below, saying the user has requested a page that was not found in the app’s pages/ directory.
Notes
-
Pages support magic commands.
-
Pages support run-on-save. Additionally, when you save a page, this causes a rerun for users currently viewing that exact page.
-
Adding or deleting a page causes the UI to update immediately.
-
Updating pages in the sidebar does not rerun the script.
-
st.set_page_configworks at the page level. When you set a title or favicon usingst.set_page_config, this applies to the current page only. -
Pages share the same Python modules globally:
1 | # page1.py |
- Pages share the same
st.session_state:
1 | # page1.py |
You now have a solid understanding of multipage apps. You’ve learned how to structure apps, define pages, and navigate between pages in the user interface. It’s time to create your first multipage app! 🥳
Create a multipage app
源教程链接: https://docs.streamlit.io/library/get-started/multipage-apps/create-a-multipage-app .
In the last section, we learned what it takes to create multipage apps, including how to define pages, structure and run multipage apps, and navigate between pages in the user interface. If you need a refresher, now is a good time to take a look.
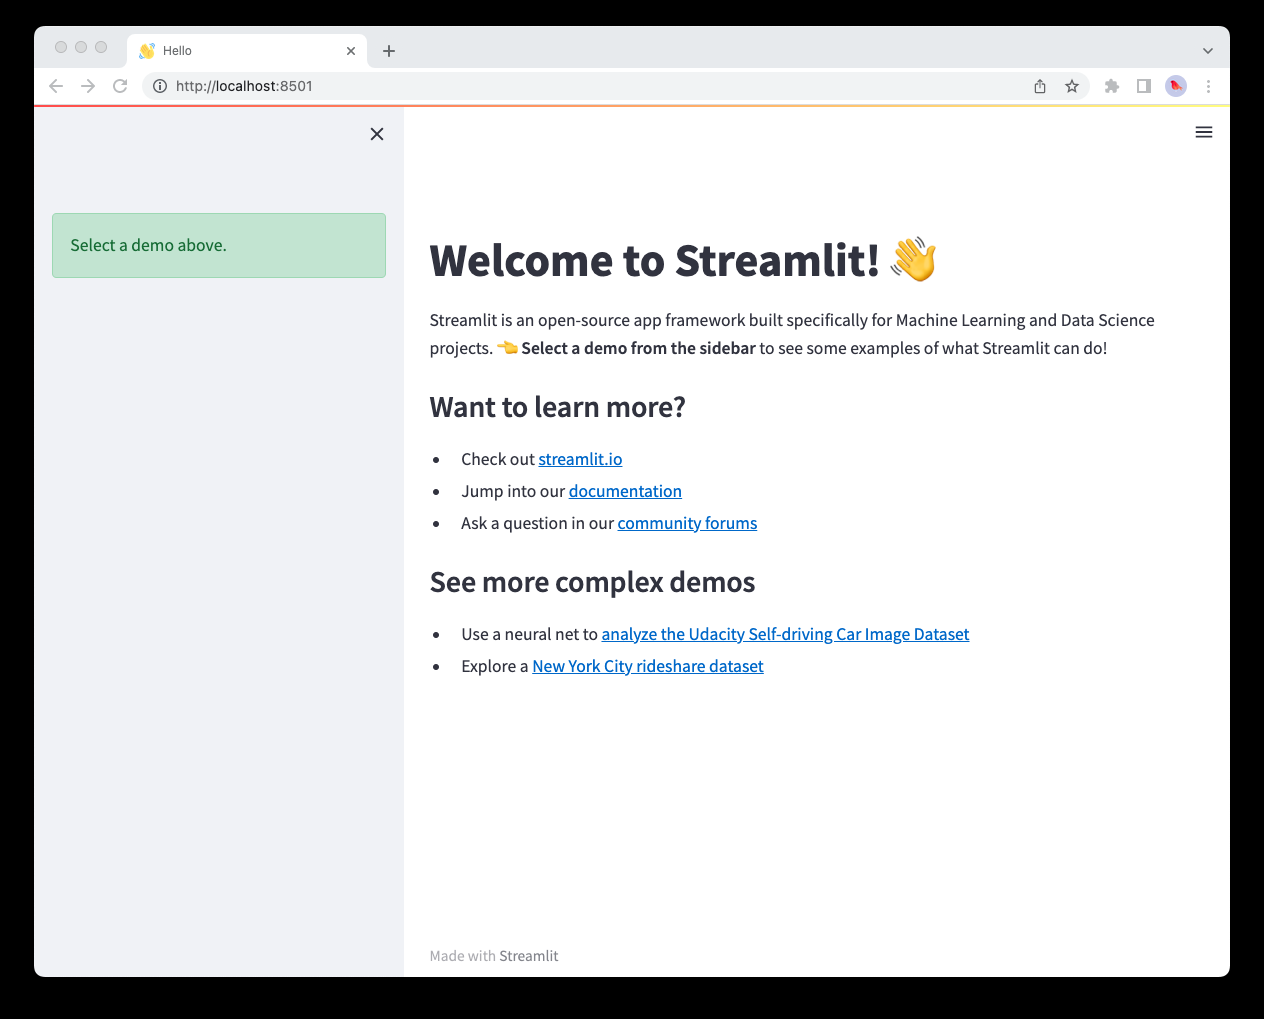
In this guide, let’s put our understanding of multipage apps to use by converting the familiar streamlit hello command to a multipage app!
Motivation
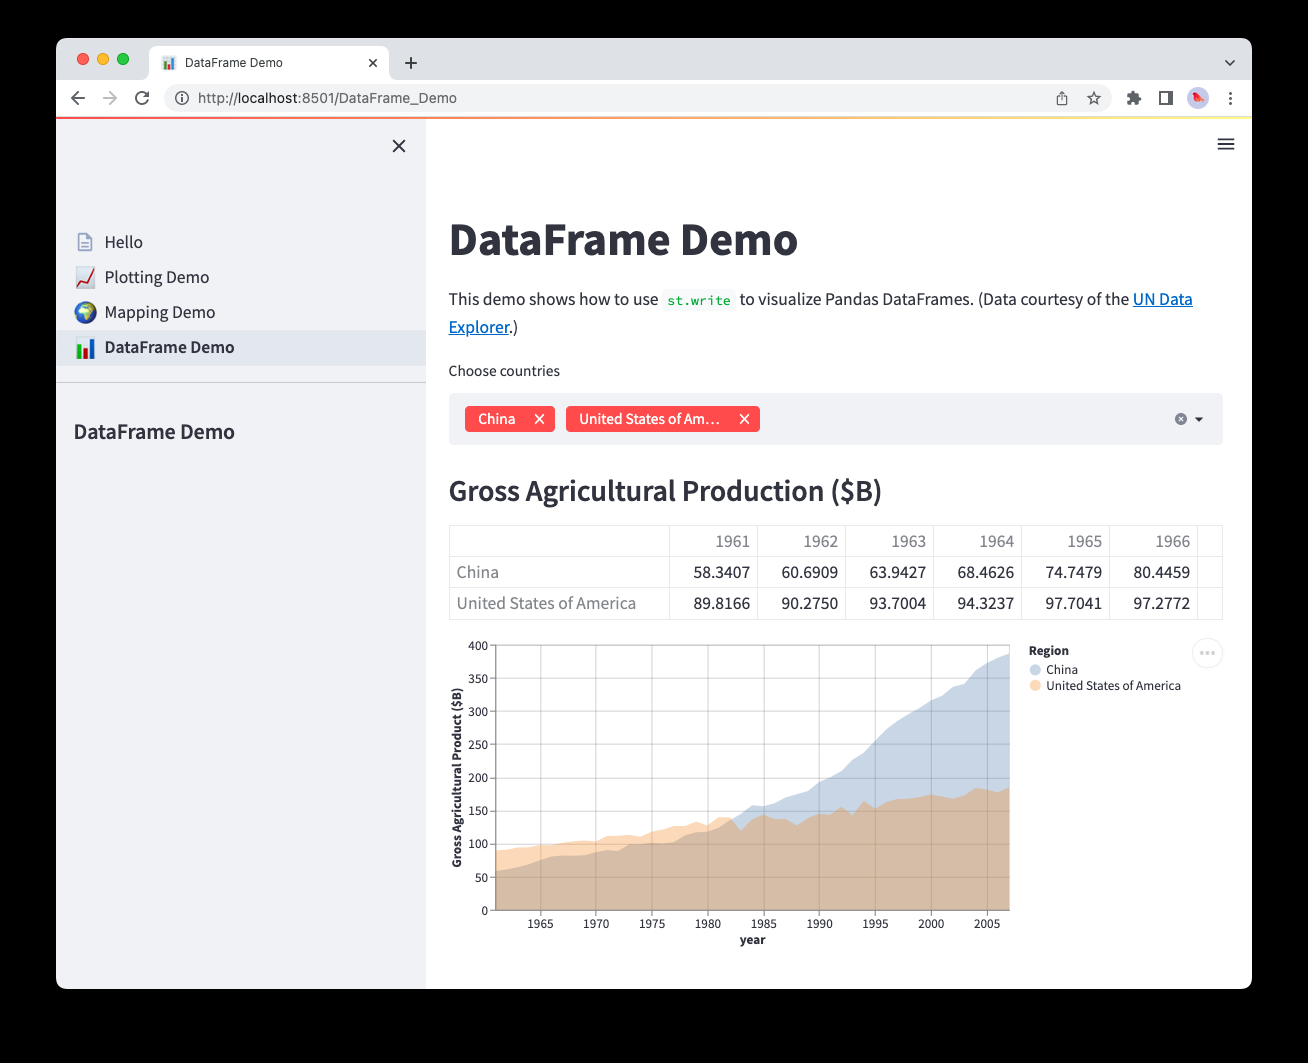
Before Streamlit 1.10.0, the streamlit hello command was a large single-page app. As there was no support for multiple pages, we resorted to splitting the app’s content using st.selectbox in the sidebar to choose what content to run. The content is comprised of three demos for plotting, mapping, and dataframes.
Here’s what the code and single-page app looked like:
1 | import streamlit as st |
Notice how large the file is! Each app “page" is written as a function, and the selectbox is used to pick which page to display. As our app grows, maintaining the code requires a lot of additional overhead. Moreover, we’re limited by the st.selectbox UI to choose which “page" to run, we cannot customize individual page titles with st.set_page_config, and we’re unable to navigate between pages using URLs.
Convert an existing app into a multipage app
Now that we’ve identified the limitations of a single-page app, what can we do about it? Armed with our knowledge from the previous section, we can convert the existing app to be a multipage app, of course! At a high level, we need to perform the following steps:
-
Create a new
pagesfolder in the same folder where the “entrypoint file" (hello.py) lives -
Rename our entrypoint file to
Hello.py, so that the title in the sidebar is capitalized -
Create three new files inside of
pages:-
pages/1_📈_Plotting_Demo.py -
pages/2_🌍_Mapping_Demo.py -
pages/3_📊_DataFrame_Demo.py
-
-
Move the contents of the
plotting_demo,mapping_demo, anddata_frame_demofunctions into their corresponding new files from Step 3 -
Run
streamlit run Hello.pyto view your newly converted multipage app!
Now, let’s walk through each step of the process and view the corresponding changes in code.
Create the entrypoint file
Hello.py
1 | import streamlit as st |
We rename our entrypoint file to Hello.py , so that the title in the sidebar is capitalized and only the code for the intro page is included. Additionally, we’re able to customize the page title and favicon — as it appears in the browser tab with st.set_page_config. We can do so for each of our pages too!
Notice how the sidebar does not contain page labels as we haven’t created any pages yet.
Create multiple pages
A few things to remember here:
-
We can change the ordering of pages in our MPA by adding numbers to the beginning of each Python file. If we add a 1 to the front of our file name, Streamlit will put that file first in the list.
-
The name of each Streamlit app is determined by the file name, so to change the app name you need to change the file name!
-
We can add some fun to our app by adding emojis to our file names that will render in our Streamlit app.
-
Each page will have its own URL, defined by the name of the file.
Check out how we do all this below! For each new page, we create a new file inside the pages folder, and add the appropriate demo code into it.
pages/1_📈_Plotting_Demo.py
1 | import streamlit as st |
pages/2_🌍_Mapping_Demo.py
1 | import streamlit as st |
pages/3_📊_DataFrame_Demo.py
1 | import streamlit as st |
With our additional pages created, we can now put it all together in the final step below.
Run the multipage app
To run your newly converted multipage app, run:
1 | streamlit run Hello.py |
That’s it! The Hello.py script now corresponds to the main page of your app, and other scripts that Streamlit finds in the pages folder will also be present in the new page selector that appears in the sidebar.
Next steps
Congratulations! 🎉 If you’ve read this far, chances are you’ve learned to create both single-page and multipage apps. Where you go from here is entirely up to your creativity! We’re excited to see what you’ll build now that adding additional pages to your apps is easier than ever. Try adding more pages to the app we’ve just built as an exercise. Also, stop by the forum to show off your multipage apps with the Streamlit community! 🎈
Here are a few resources to help you get started:
-
Deploy your app for free on Streamlit’s Community Cloud.
-
Post a question or share your multipage app on our community forum.
-
Check out our documentation on multipage apps.
-
Read through Advanced features for things like caching, theming, and adding statefulness to apps.
-
Browse our API reference for examples of every Streamlit command.
结语
第七十二篇博文写完,开心!!!!
今天,也是充满希望的一天。
 wechat
 alipay